home
Welcome to the Startup Cartography Project!
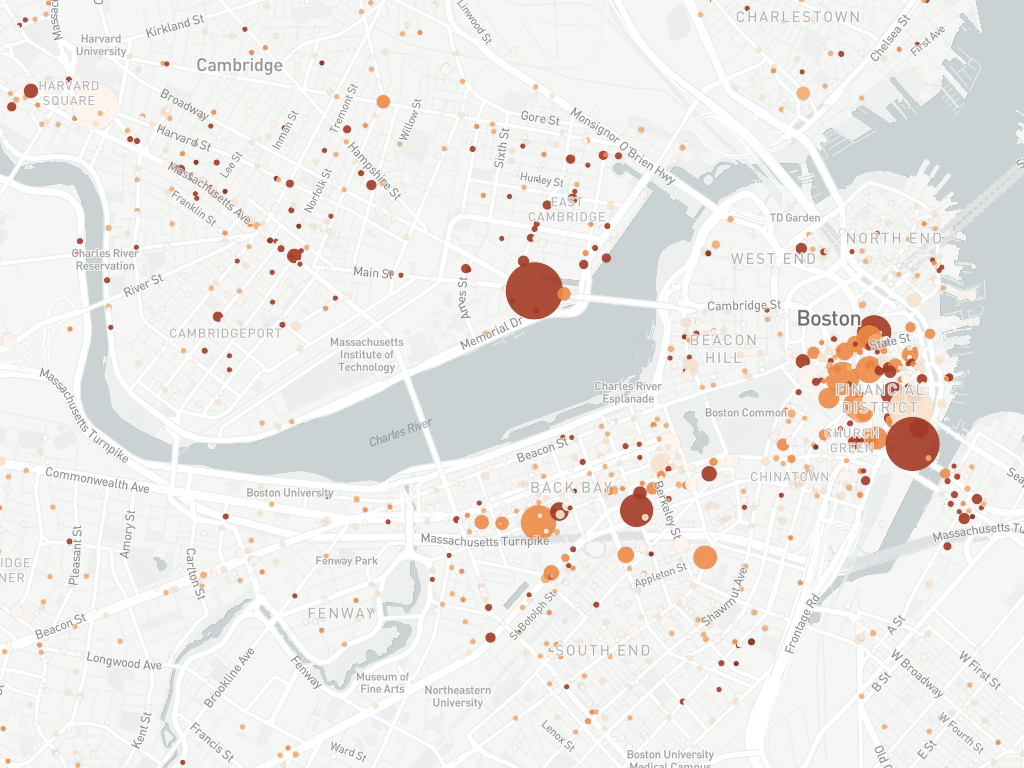
This project leverages population-level business registration records and predictive analytics to form novel measures of entrepreneurial quantity, quality and performance at an arbitrary level of geographic and temporal granularity. The purpose of this website is to provide a public access interactive website, data repository, and research archive that makes this work accessible to researchers, public and private sector analysts, and the public. The website tools are designed to facilitate detailed visualization of entrepreneurial ecosystems (at multiple levels of visualization), track entrepreneurial dynamics over time, and provide data that might be applicable to a wide range of research and policy purposes.
This project is motivated by a simple observation: while entrepreneurship is widely seen as a foundation for economic growth and social progress, only a very small fraction of all startups realize the extraordinary level of growth (in terms of jobs, revenue or valuation) that can propel economy-wide dynamism. As such, a central question for research, policy and practice is understanding the initial rate of startup formation, the underlying growth potential for startups that are founded within a given population, and the ultimate performance of startup cohorts across regions and over time.
With generous support from the Kauffman Foundation, the Startup Cartography Project addresses this challenge by using a combination of publicly available business registration records, predictive analytics, and new visualization and analysis tools. Our approach, first introduced in Guzman and Stern (2015) and described in more detail in Andrews, et al. (2019), introduces four distinct (but related) entrepreneurship statistics:
The Startup Formation Rate (SFR) – the quantity of new business registrants within a given population
The Entrepreneurial Quality Index (EQI) —the average growth potential (or “quality”) within a group of startups.
The Regional Entrepreneurship Cohort Potential Index (RECPI) —the number of startups within a particular location or region expected to later achieve a significant growth outcome (SFR*EQI).
The Regional Entrepreneurship Acceleration Index (REAI)—the ability of a region to convert entrepreneurial potential into realized growth (# of Growth Outcomes / RECPI).
Our research and policy analysis is yielding new findings and insights about the relationship of entrepreneurship and economic development. We find that, while entrepreneurial quality is correlated with economic growth, entrepreneurial quantity is not. The rate at which high-potential growth startups are founded is sensitive to the capital market and overall market conditions. Strong differences across place and time exist not only in the formation of high growth-potential startups, but also the likelihood of startups (for a given quality level) to realize their potential and scale. Put a different way, different regions exhibit dramatically different rates and levels of high-potential growth entrepreneurship. Being able to see the level of and trends related to entrepreneurial quality, quantity and impact can provide local and regional stakeholders with a much clearer view of the potential and trajectory of startup formation there.
Our data covers 26 years of business registration data across 49 states and Washington DC, and 28 years of data among 46 states (and will continue to grow over time) and Washington DC. Our interactive map allows for observation of the key statistics to the different level of feasible geographic granularity (e.g. address, city, MSA, and state level). In addition, for research purposes, we are planning to make available zip code level and county level aggregates for entrepreneurial quantity, quality and ecosystem measures for that same time-frame. Our goal is to build this prototype into a publicly-available tool and data infrastructure that will help researchers, policymakers, students and other stakeholders to visualize entrepreneurial quality, see how it changes over time, and compare the state of entrepreneurship across regions, to better understand its drivers and impacts.
Our content for this site has been organized into four sections: (1) Research Papers and Methodology; (2) Interactive U.S. Map; (3) Visualization and Presentation Library; and (4) Downloadable Data. While our goal is to make this content open, please note that this is part of our ongoing research and policy agenda. We plan to make these materials available under a creative commons, attribution, non-commercial, share-alike license (CC BY-NC-SA). In the interim, please let us know before sharing any materials found on this site and provide attribution to our work on any derivative use. We look forward to receiving your feedback.
Thank you!